Stop guessing. Start measuring. Cut energy waste with thermal analytics.
HeatMetrix™ turns your FLIR infrared images into serious, actionable metrics — pinpointing hidden hotspots, cooling inefficiencies, and energy waste across data centers and facilities before they cost you money.
Most facilities sit on a goldmine of untapped thermal data. HeatMetrix™ extracts it for you — no specialist software, no complex integrations, no learning curve.
1
Capture & send your infrared images
Not sure where to start? Our thermal experts will advise you on exactly which surfaces to capture and how to get the most from your FLIR camera — completely free. Once you're ready, simply send us your images and we handle the rest.
Radiometric JPEGCSV exportAll FLIR formats
🖥 Data centers
Server inlet temperatures
Rack exhaust hotspots
Ceiling & floor surfaces
Cross-rack heat comparisons
🏢 Other facilities
Exterior & interior walls
Ceiling & floor surfaces
Office buildings
Warehouses & industrial
→
2
Receive your analytics report & start saving
We deliver a detailed HeatMetrix™ report that transforms your images into clear, quantified insights. Know exactly where energy is being wasted, where equipment is at risk, and where to act first — so every improvement dollar goes further.
Typical outcomes
Reduced cooling overhead · Early fault detection · Lower PUE scores · Compliance-ready documentation
Equipment
Works with any FLIR camera
Our analysis pipeline is compatible with all FLIR infrared cameras used in data center and facility inspection workflows.
FLIR infrared camera capturing thermal data from server rack infrastructure
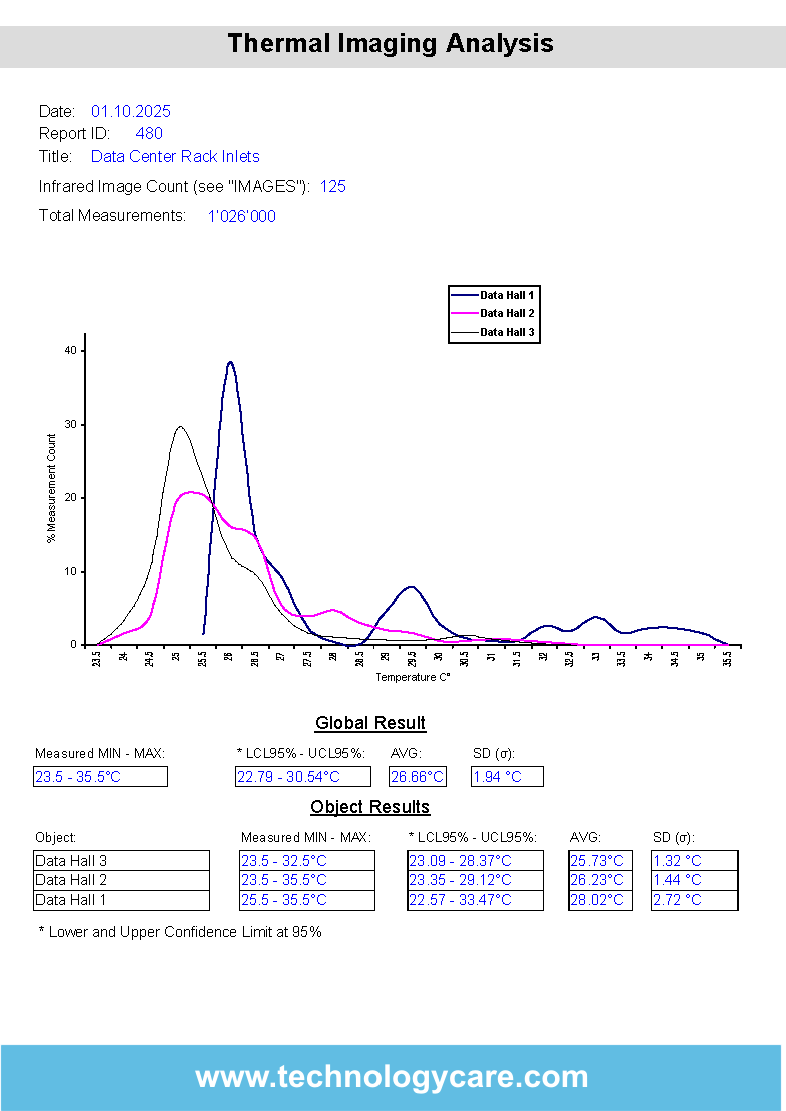
Sample output
What your report looks like
Our reports visualize the thermal dynamics of your data center with actionable insights including temperature histograms, heat maps, and statistical summaries.
Example HeatMetrix™ report — temperature histograms, thermal maps, and statistical analysis
📊
Temperature histograms
Full distribution analysis across all measured zones with percentile breakdowns.
🔥
Hotspot detection
Automated identification of thermal anomalies and high-risk areas before they become failures.
📈
Statistical analysis
Mean, median, standard deviation and trend analysis across your thermal dataset.
⚡
Energy optimization
Actionable recommendations to reduce cooling overhead and lower PUE scores.
Free consultation
Talk to a thermal expert — at no cost
Not sure if HeatMetrix™ is right for your facility? Our team of thermal imaging specialists is happy to walk you through the process, answer your questions, and help you understand what insights you can expect — with zero commitment.